🚀 PM MAP — Real-Time PM2.5 Monitoring Application with Isopleth Map

Project Details
🏆 Project Overview
PM MAP is an Android mobile application developed as a university graduation project for monitoring and visualizing PM2.5 air quality data in real time.
The application was developed based on sensor data provided by the client, where all PM2.5 readings are collected and stored in Google Sheets. The app retrieves this data and visualizes it through dashboards, AQI indicators, statistical graphs, Google Maps integration, and Isopleth contour mapping.
The project was built using Kotlin for Android Native development, focusing on creating a clean, modern, and easy-to-use mobile interface for displaying environmental and air quality data.
One of the main highlights of this project is the ability to transform raw IoT sensor data into an interactive mobile application with real-time visualization and geographical analysis.
💡 Key Features
- - Real-time PM2.5 monitoring
- - AQI (Air Quality Index) calculation and visualization
- - Google Maps integration
- - Isopleth / Contour Map visualization
- - Sensor location monitoring
- - PM2.5 historical statistics
- - Educational content about PM2.5 and AQI
- - Online / Offline sensor status monitoring
- - Mobile-friendly Native Android UI
🎯 Project Objectives
- - Develop a mobile application for displaying PM2.5 sensor data
- - Integrate Google Sheets as the primary data source
- - Provide real-time air quality information
- - Visualize pollution distribution using Isopleth maps
- - Help students present a complete IoT + Mobile Application project
- - Create a scalable foundation for future Smart City or IoT projects
⚙️ Development Scope
🔹 Google Sheet Data Integration
- - Read PM2.5 sensor data from Google Sheets
- - Retrieve coordinates, timestamps, and sensor status
- - Process and display data inside the mobile application
- - Real-time data synchronization from Google Sheets
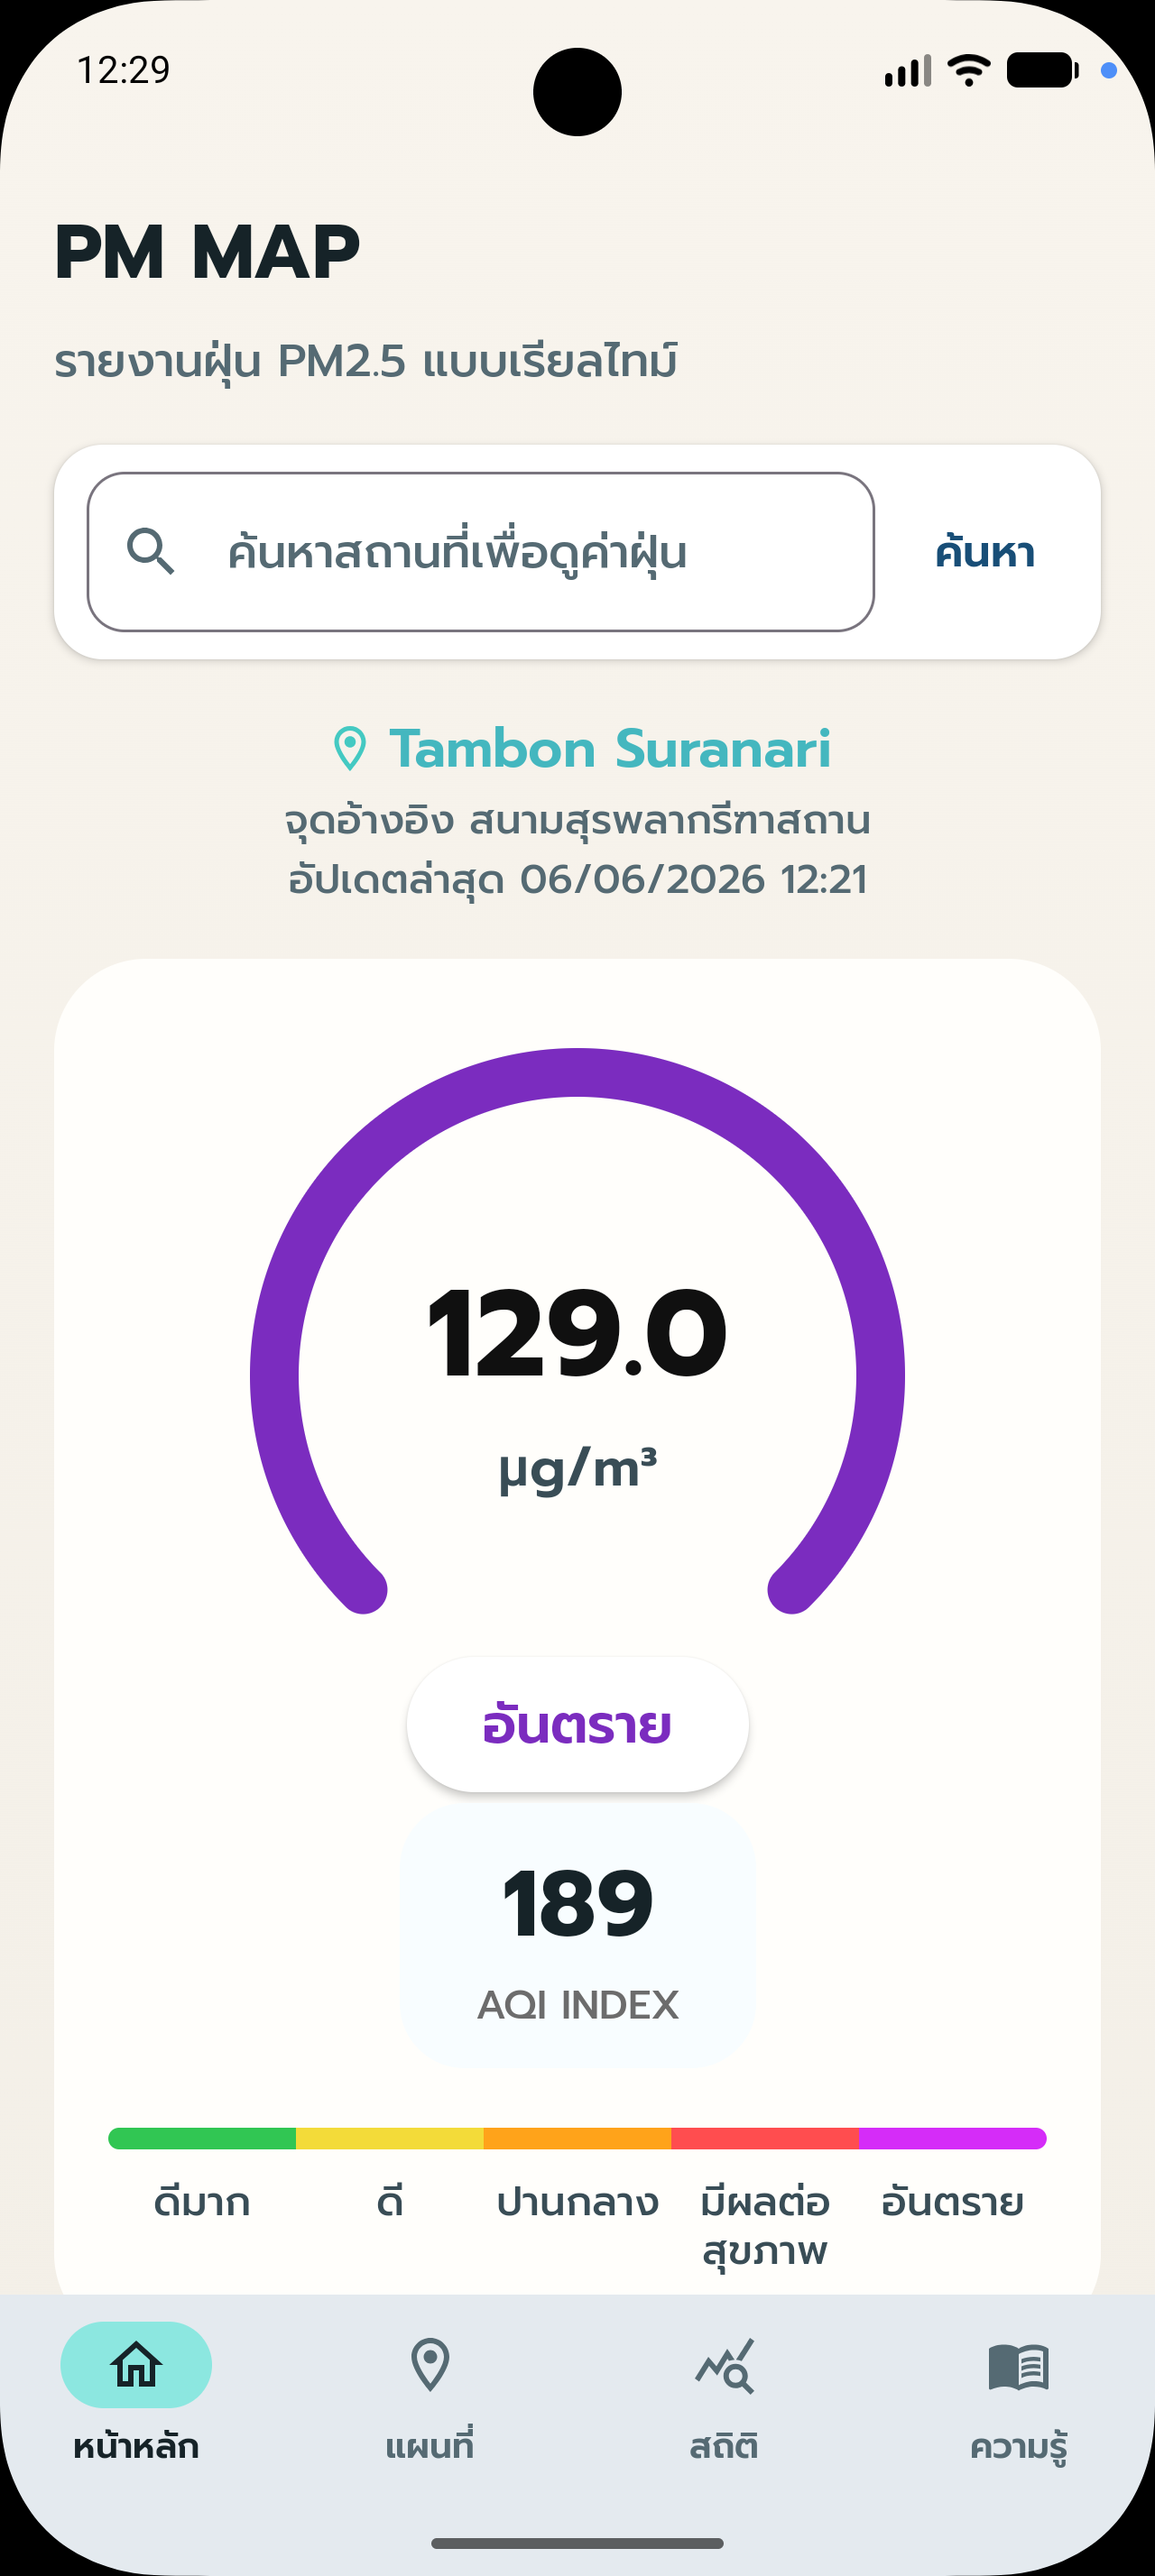
- 🔹 Main Dashboard
- - Display current PM2.5 values
- - Display AQI index
- - Show air quality levels and risk indicators
- - Display reference location and latest update time
- - AQI color-based indicators
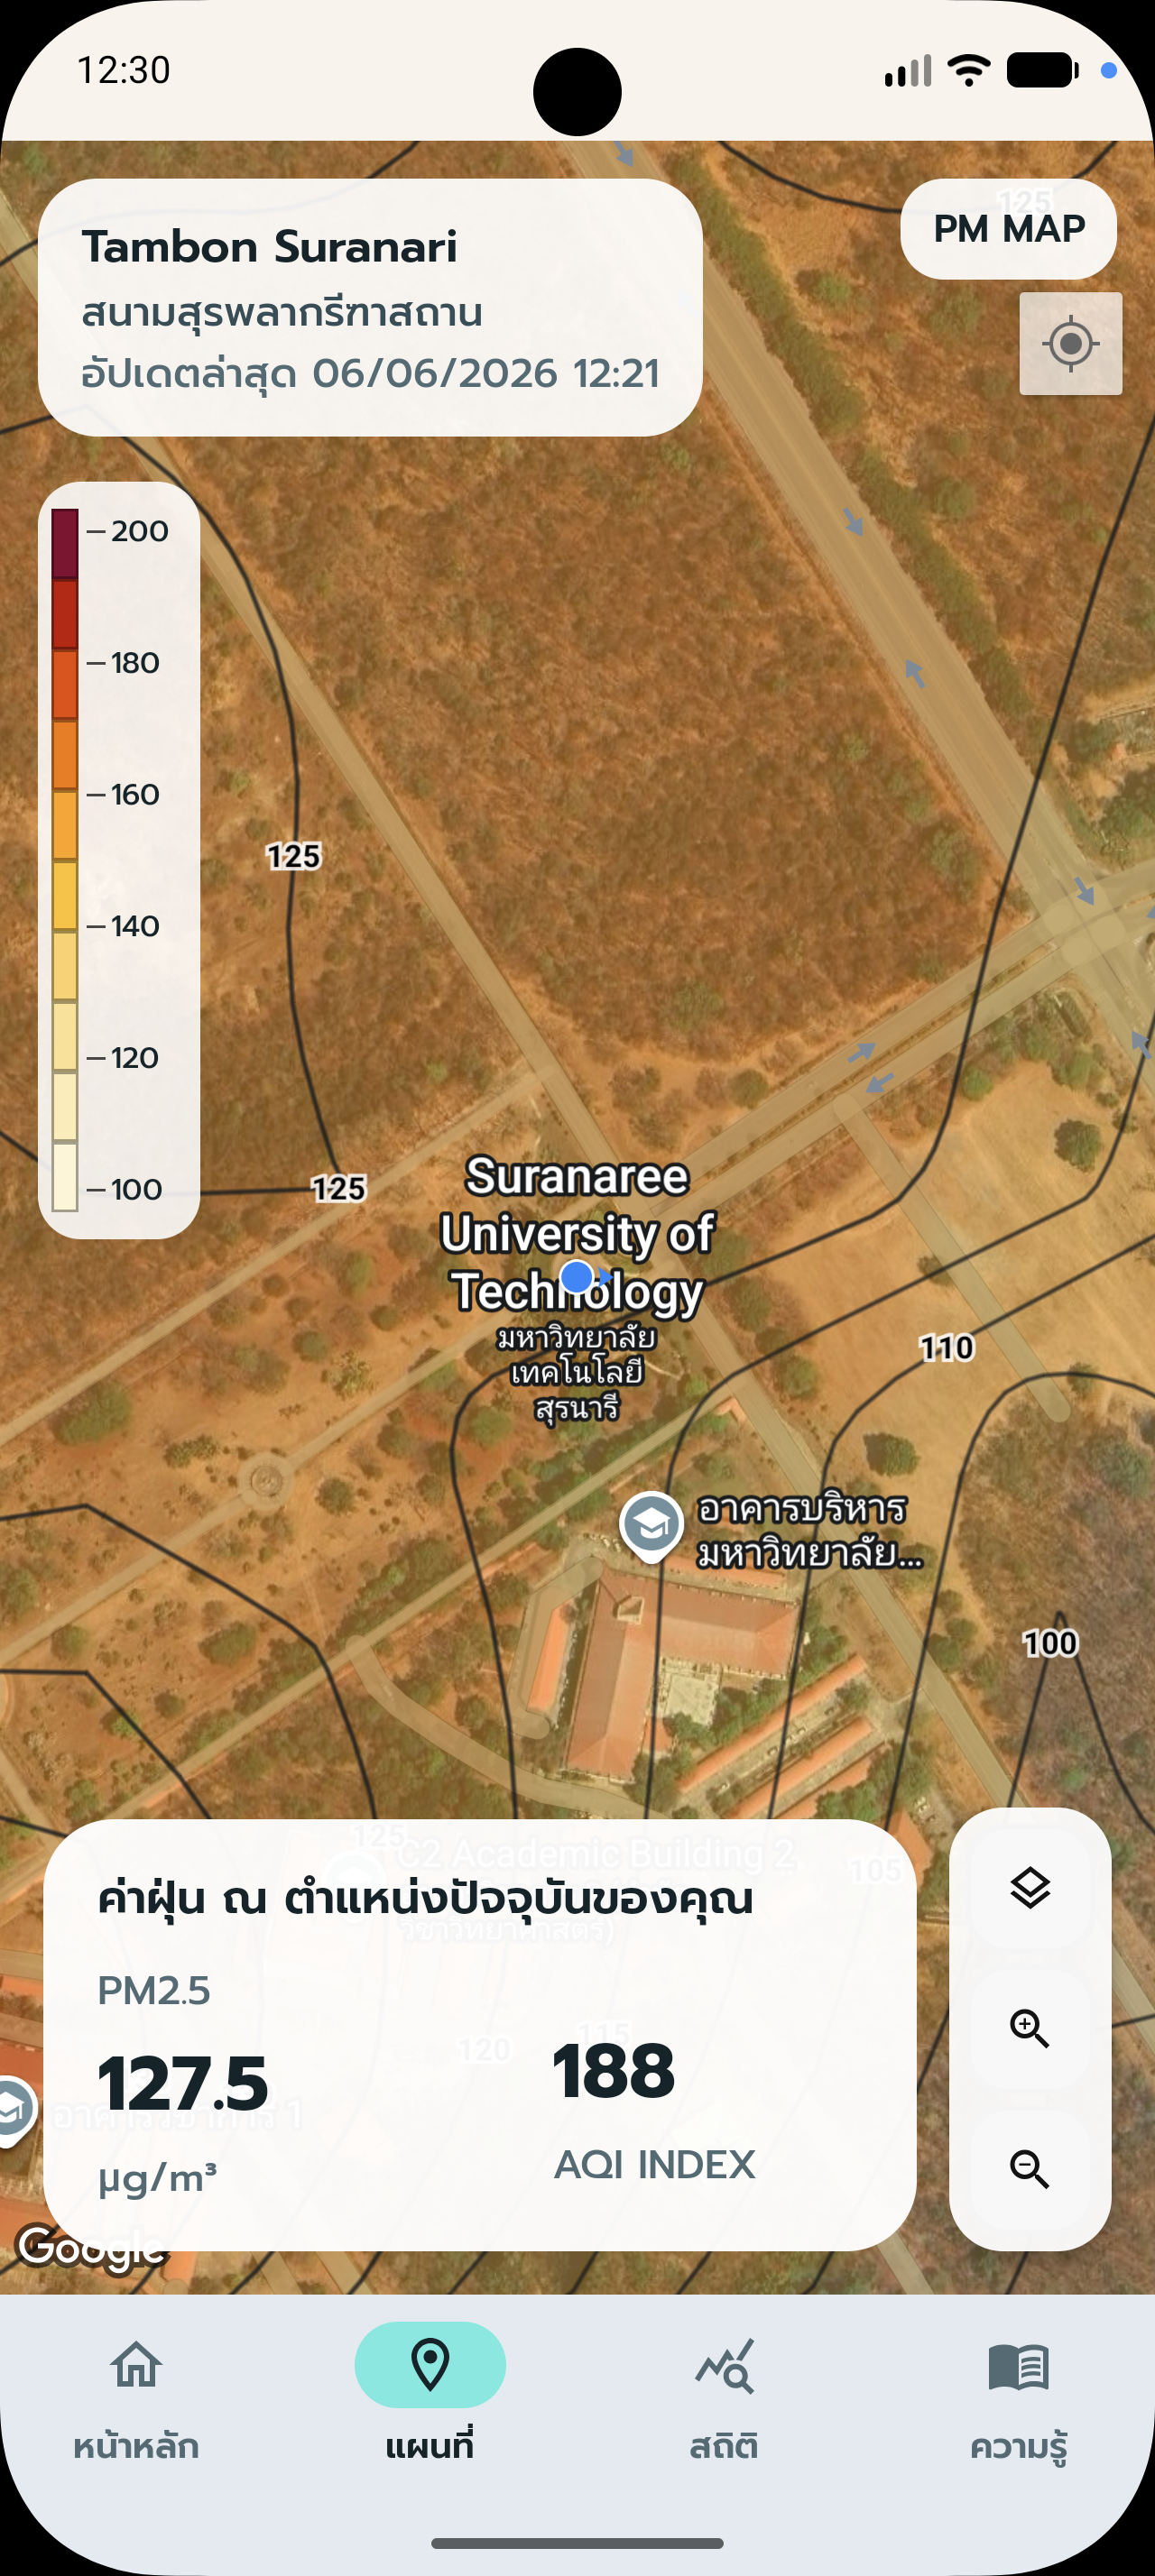
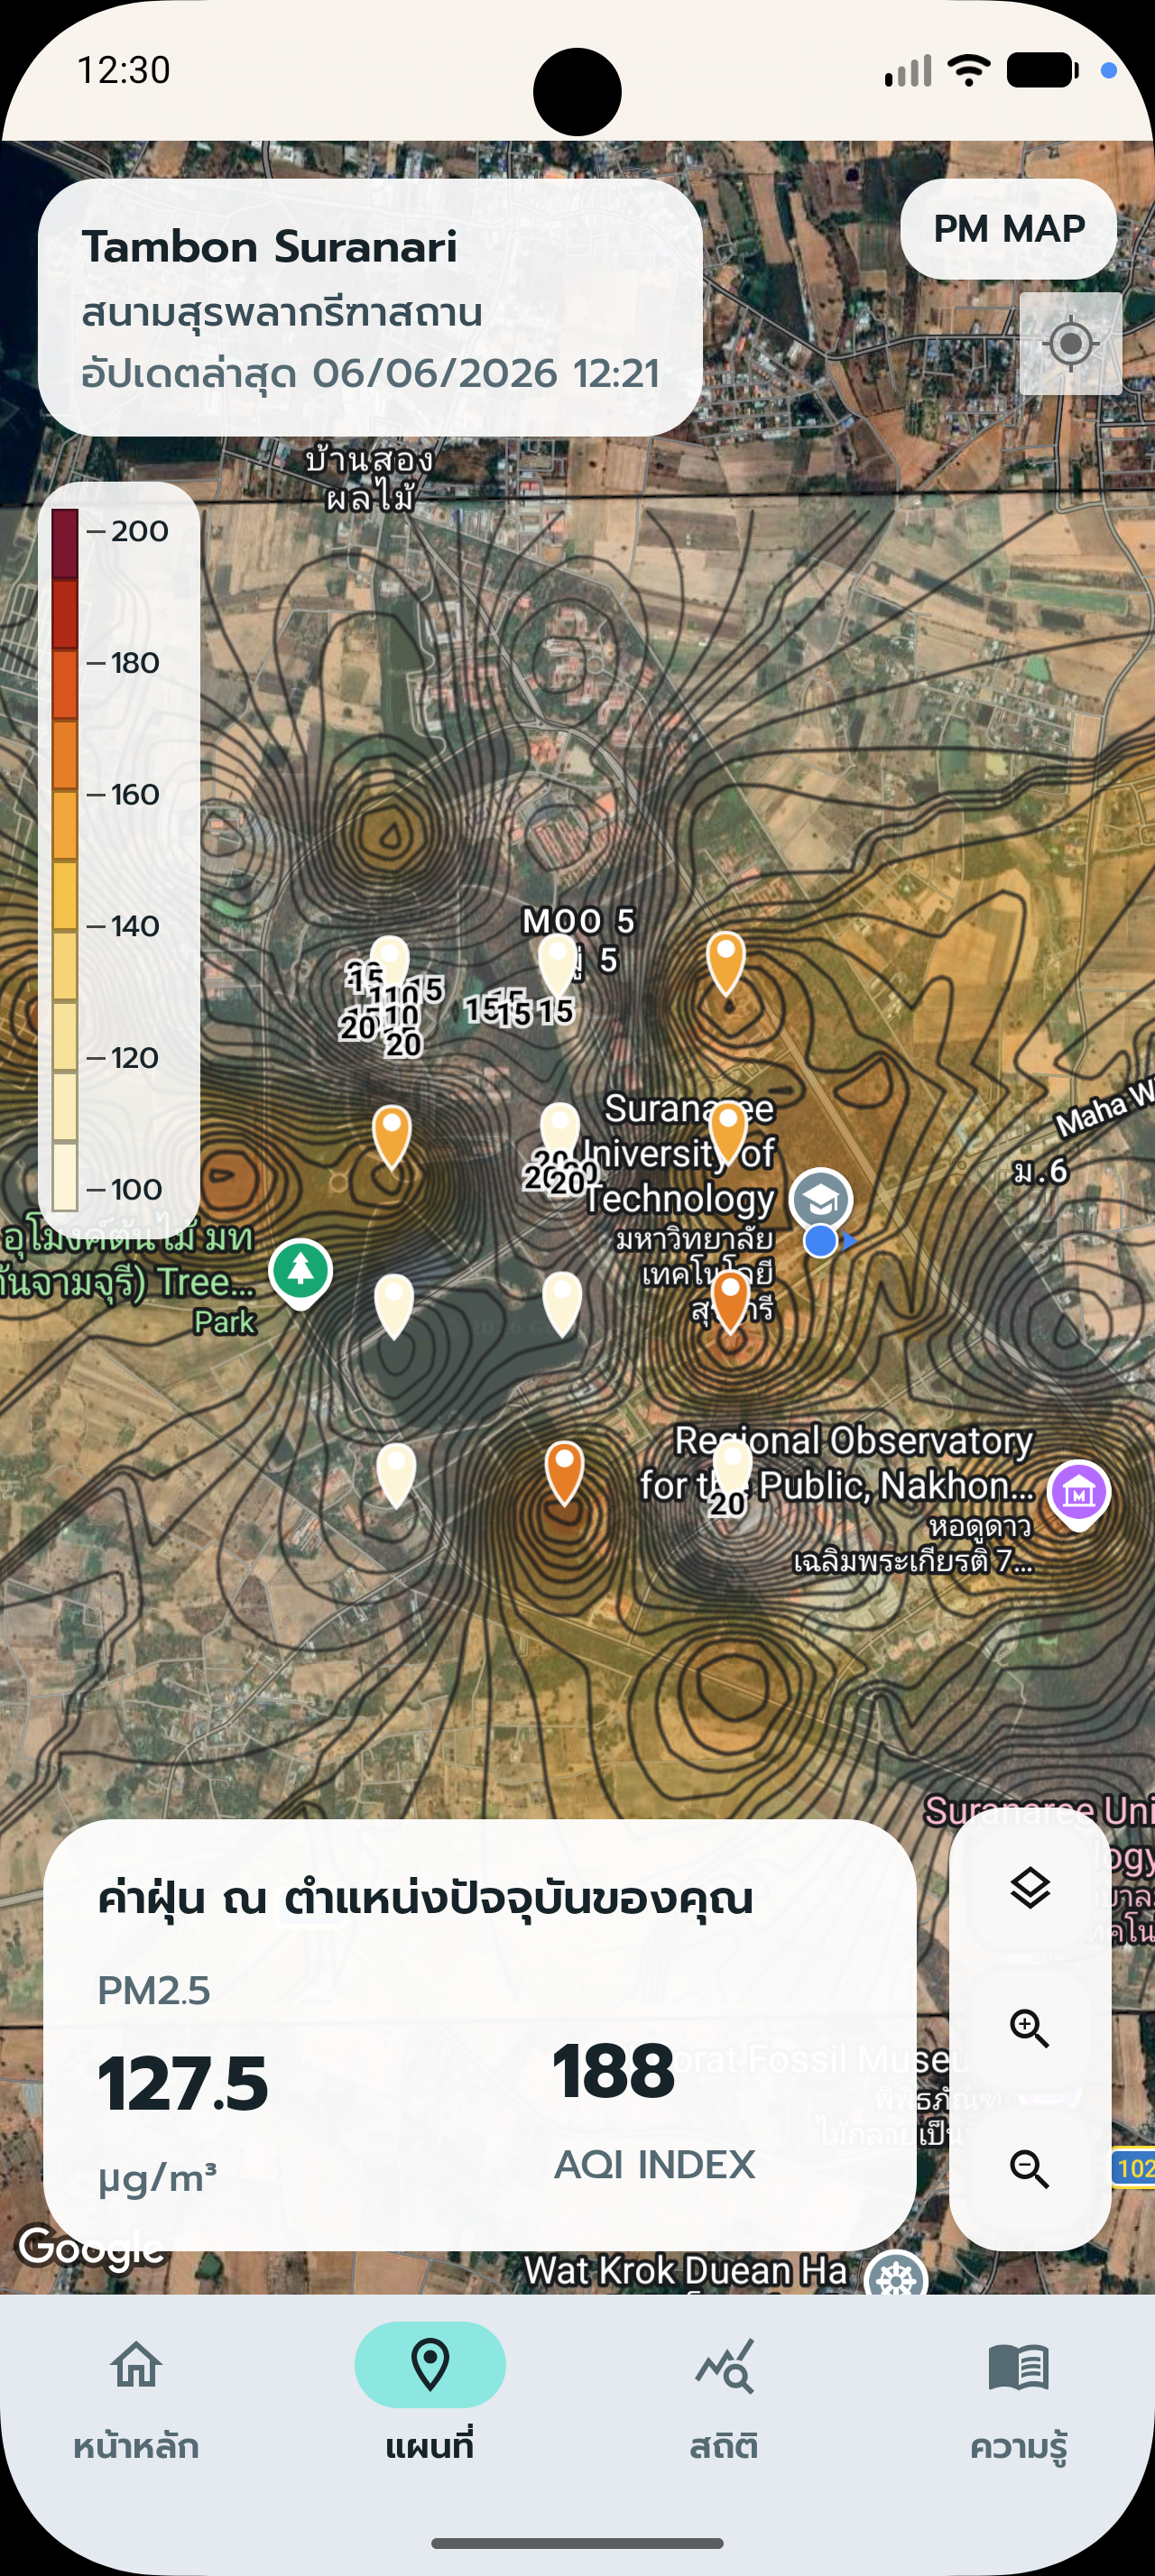
- 🔹 Map System
- - Google Maps integration
- - Current user location display
- - Sensor markers on the map
- - Real-time PM2.5 display by location
- - Isopleth / Contour overlay for pollution visualization
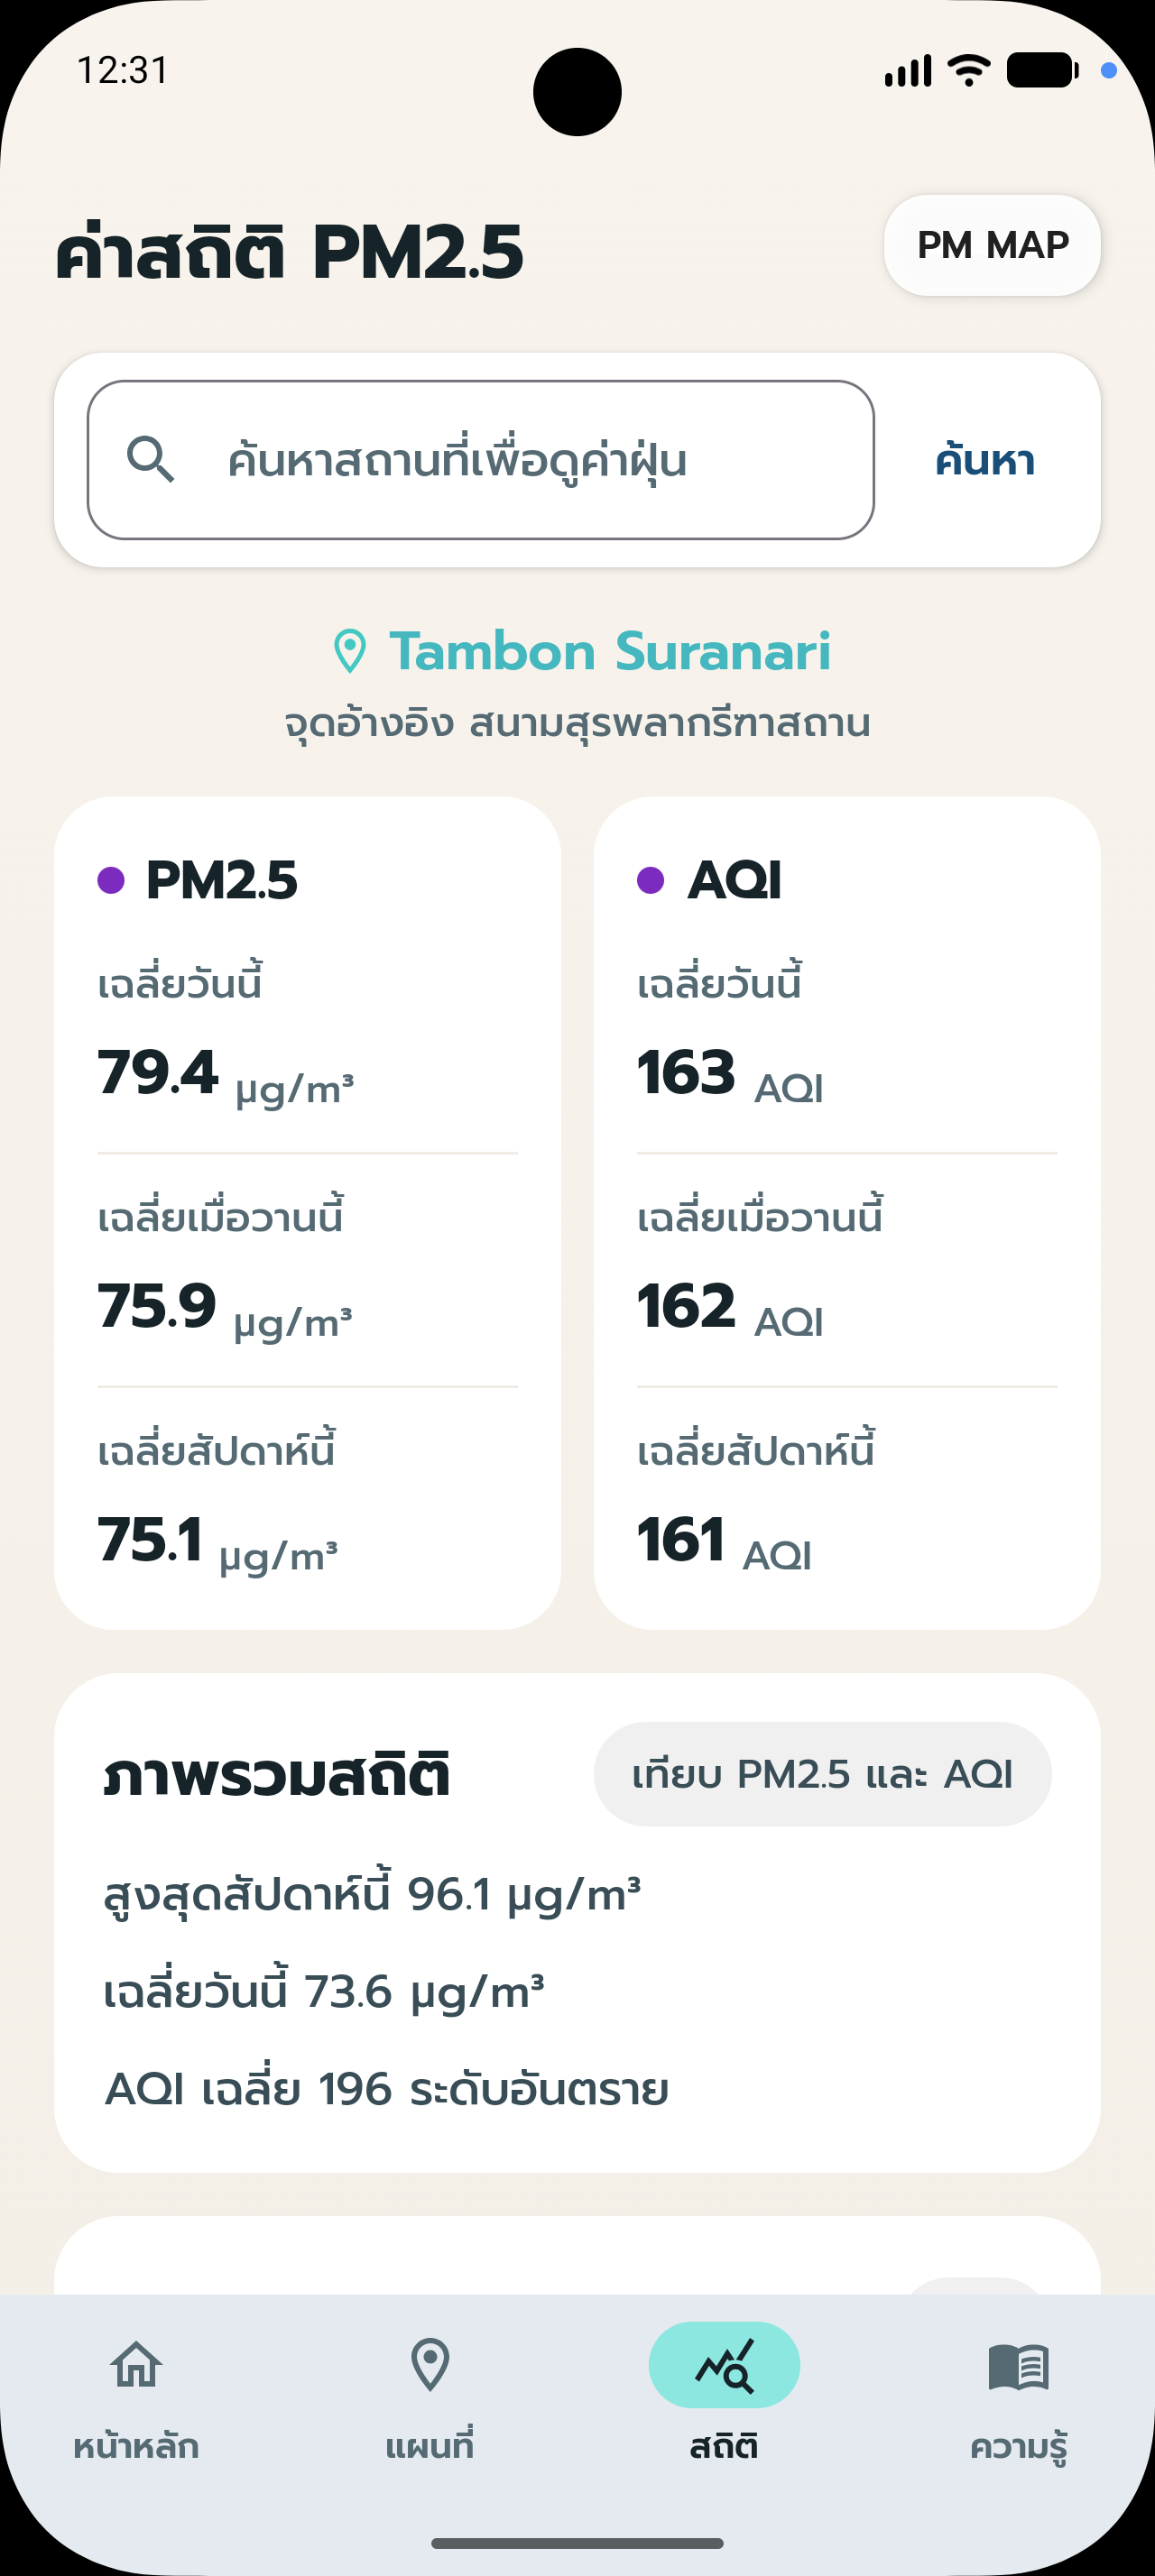
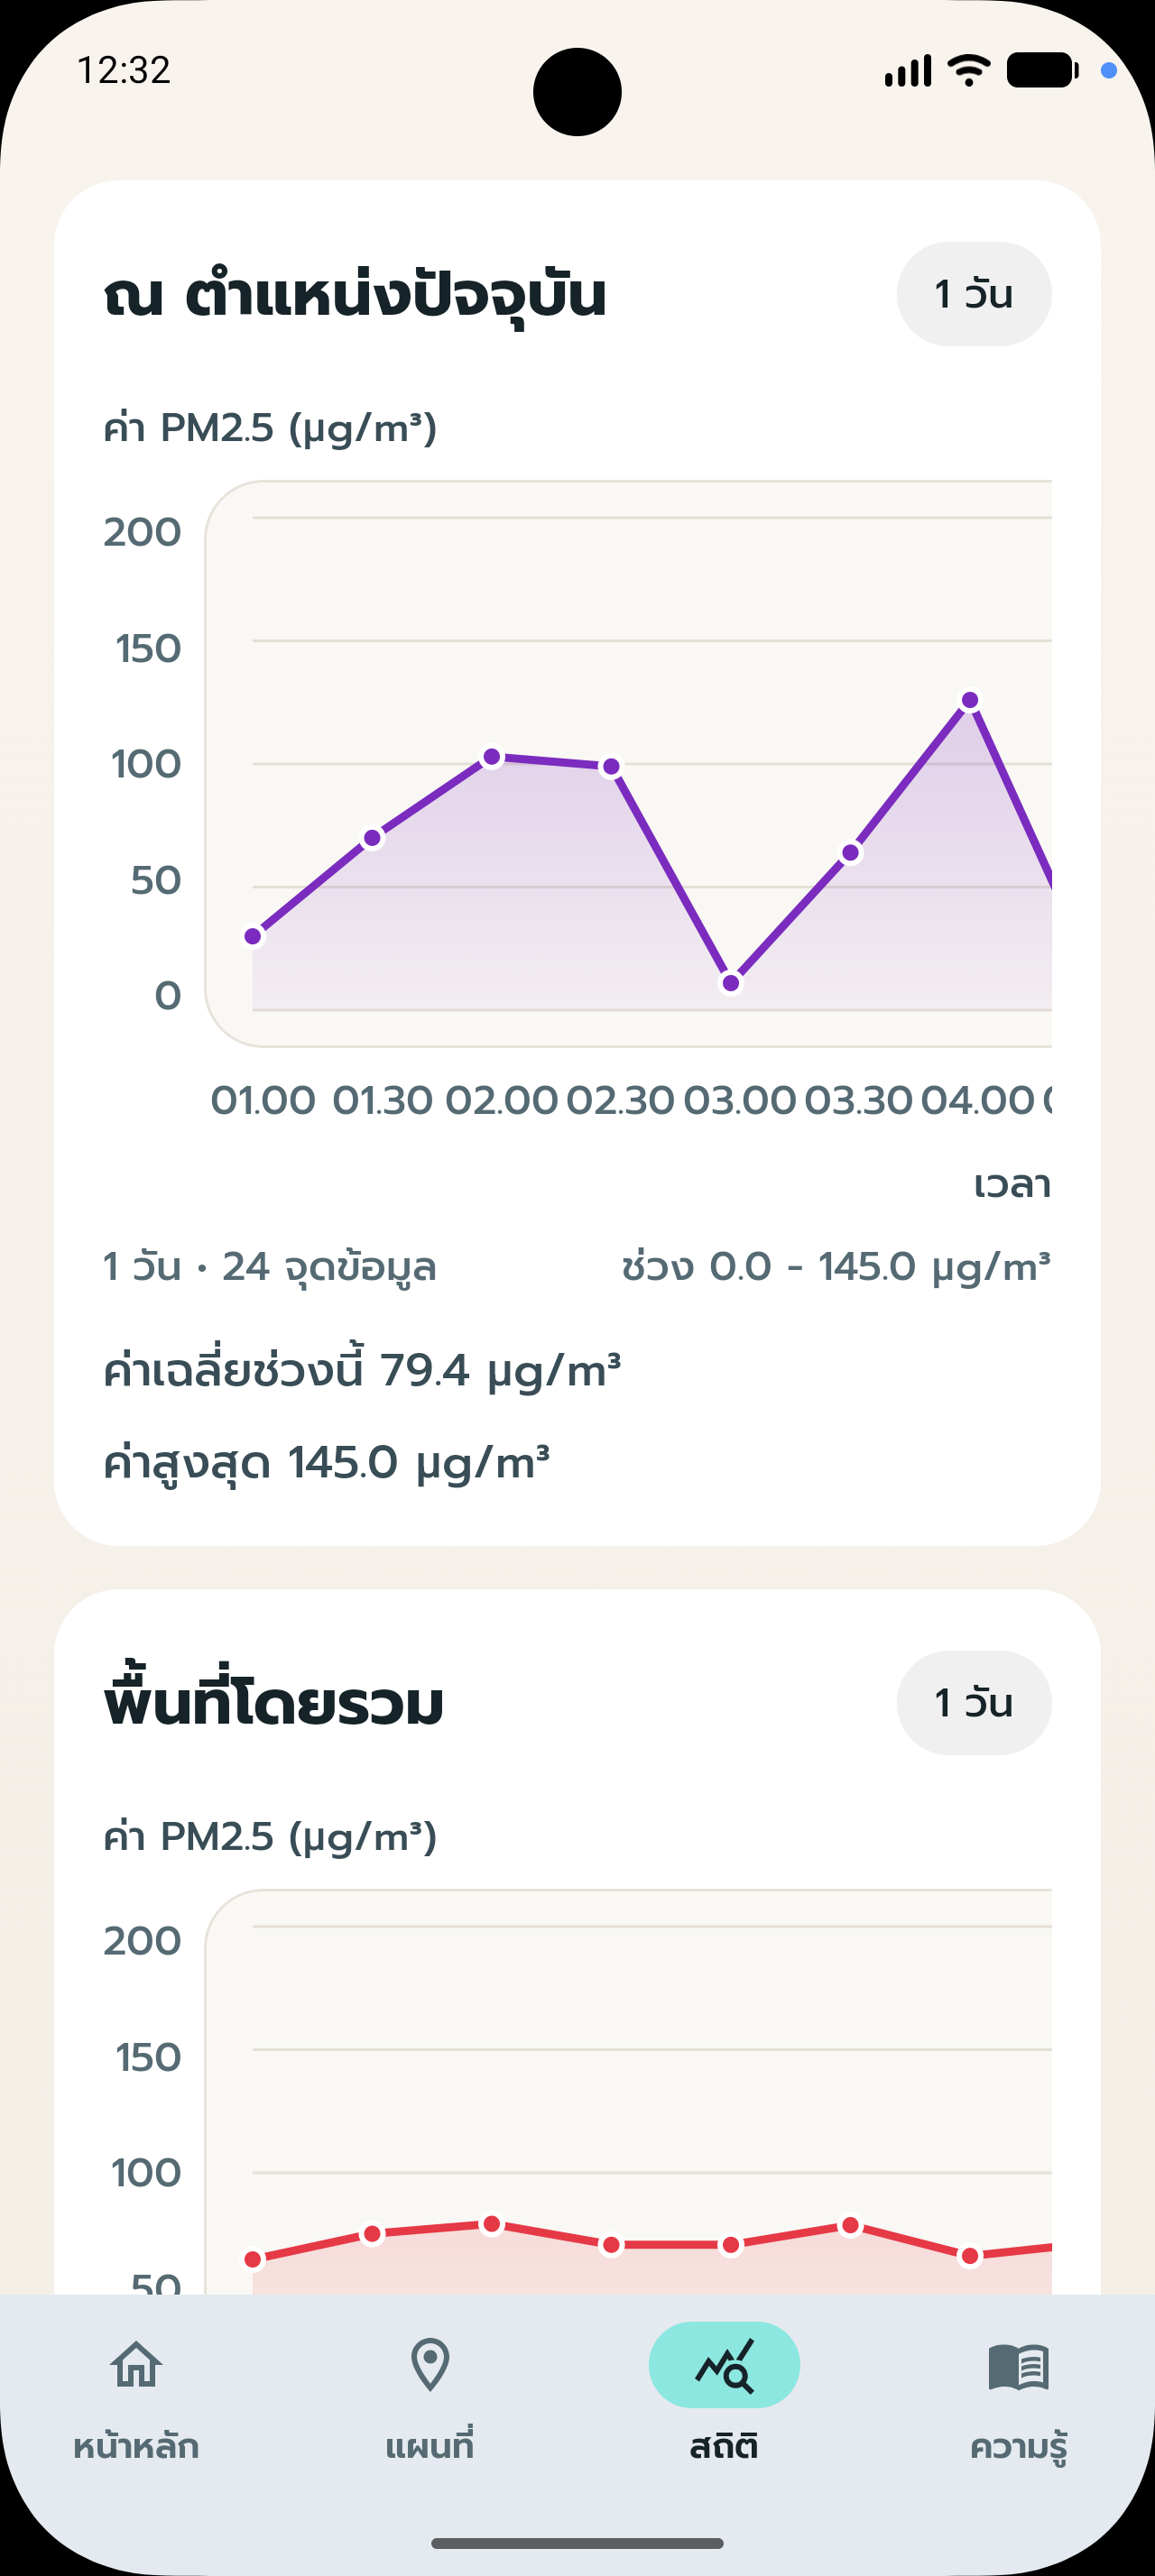
- 🔹 Statistics System
- - Daily PM2.5 statistics
- - Average and maximum values
- - Historical trend analysis
- - AQI comparison charts
- - Interactive graph visualization
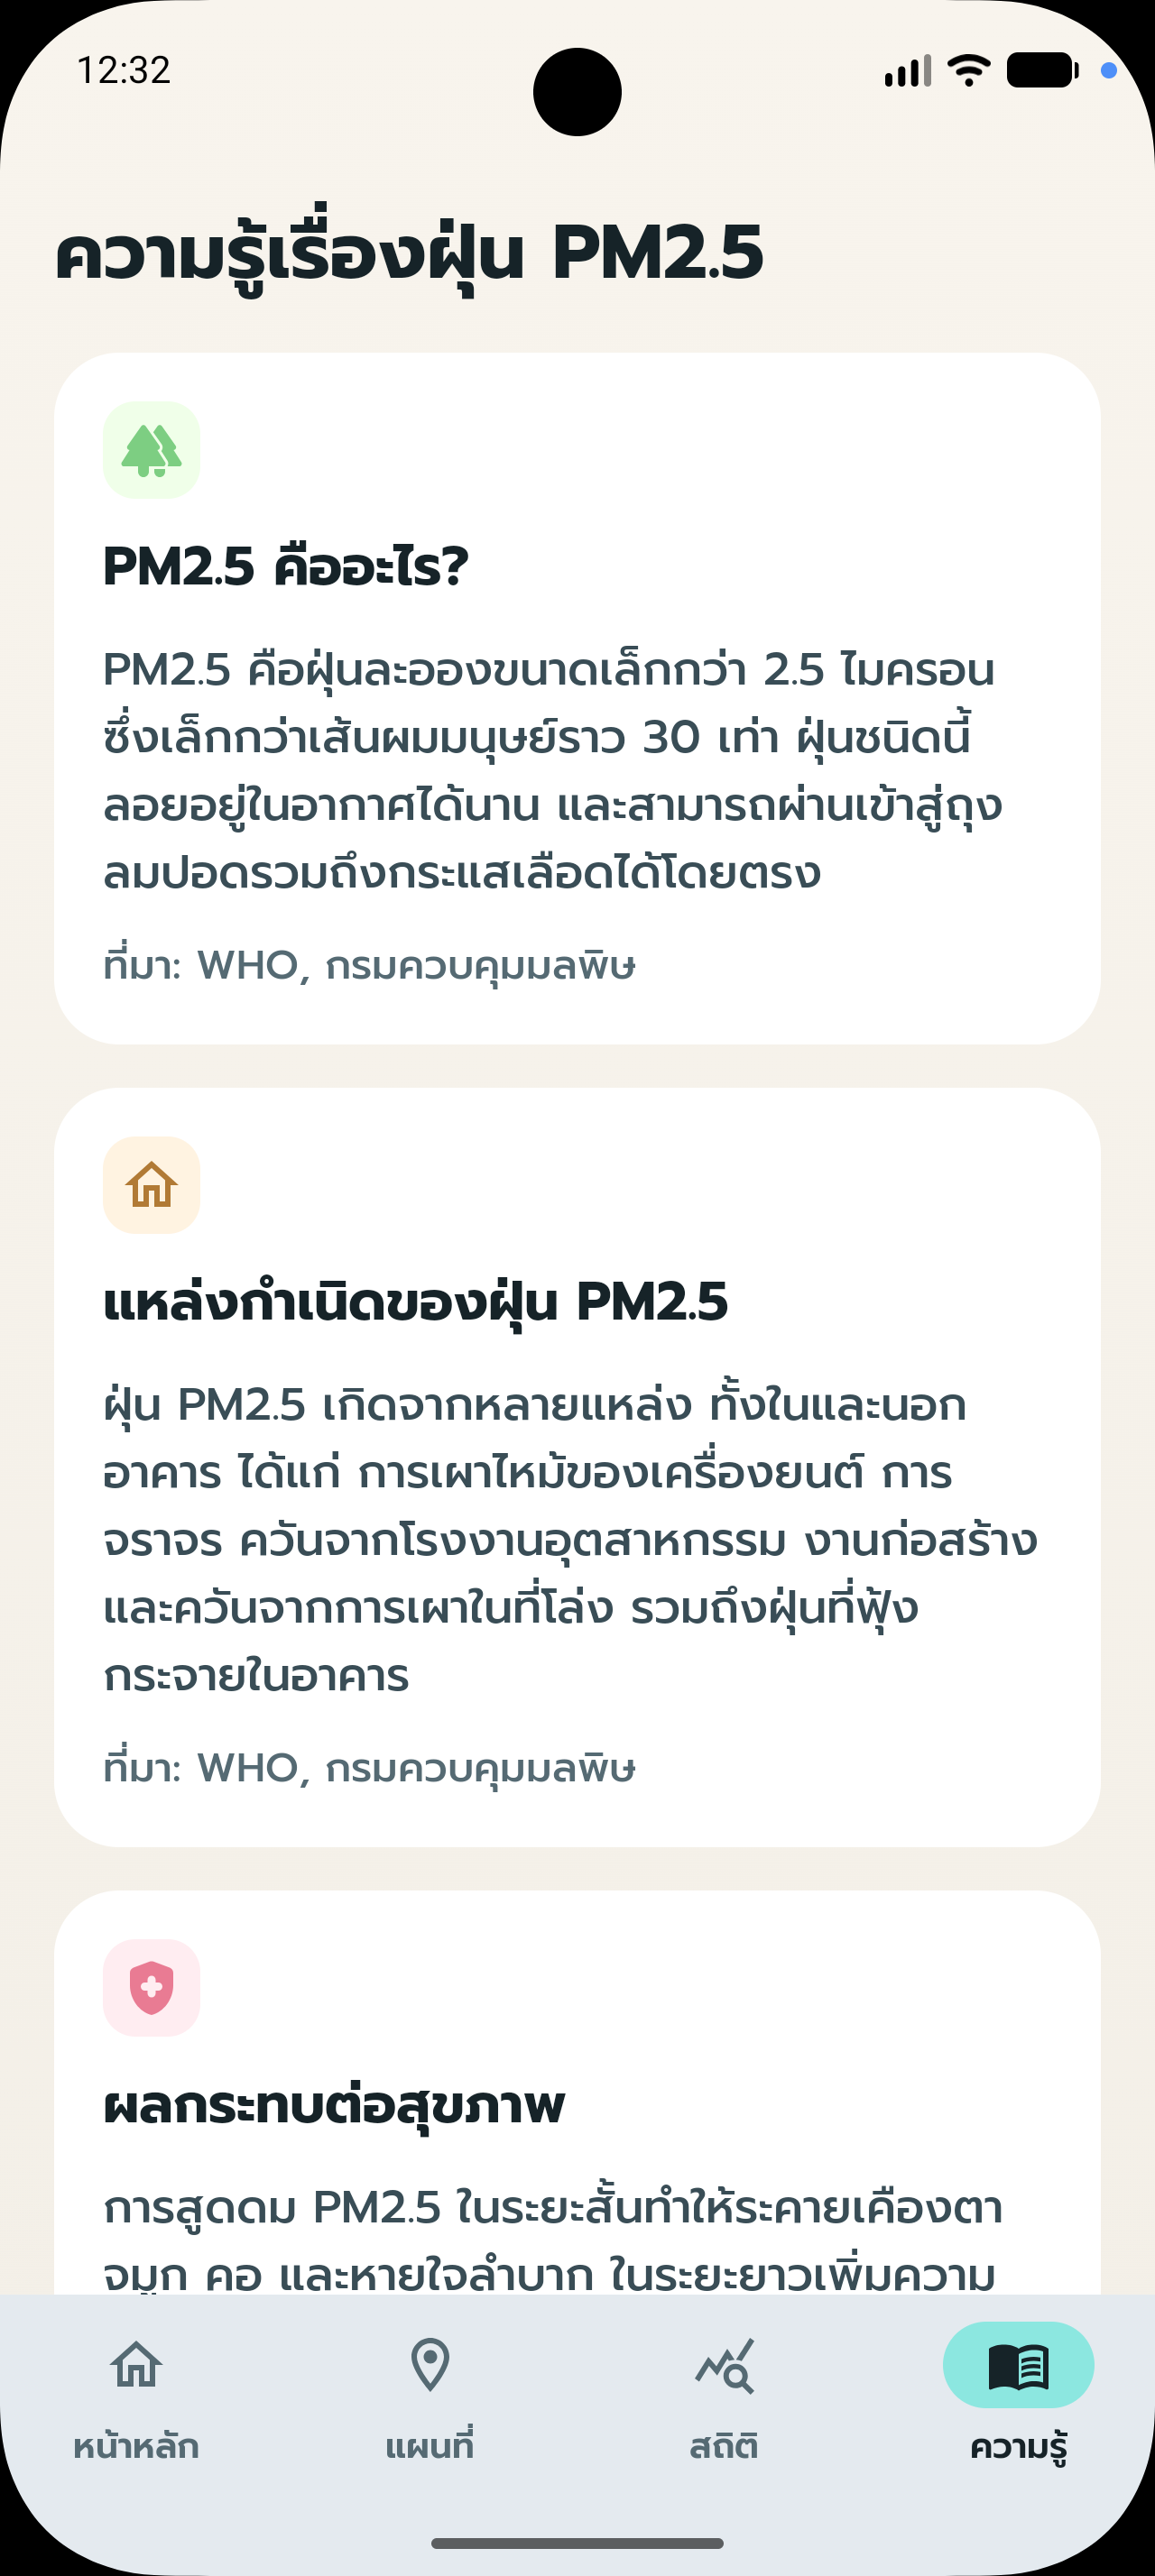
- 🔹 Knowledge Base
- - What is PM2.5?
- - PM2.5 pollution sources
- - Health impacts of PM2.5
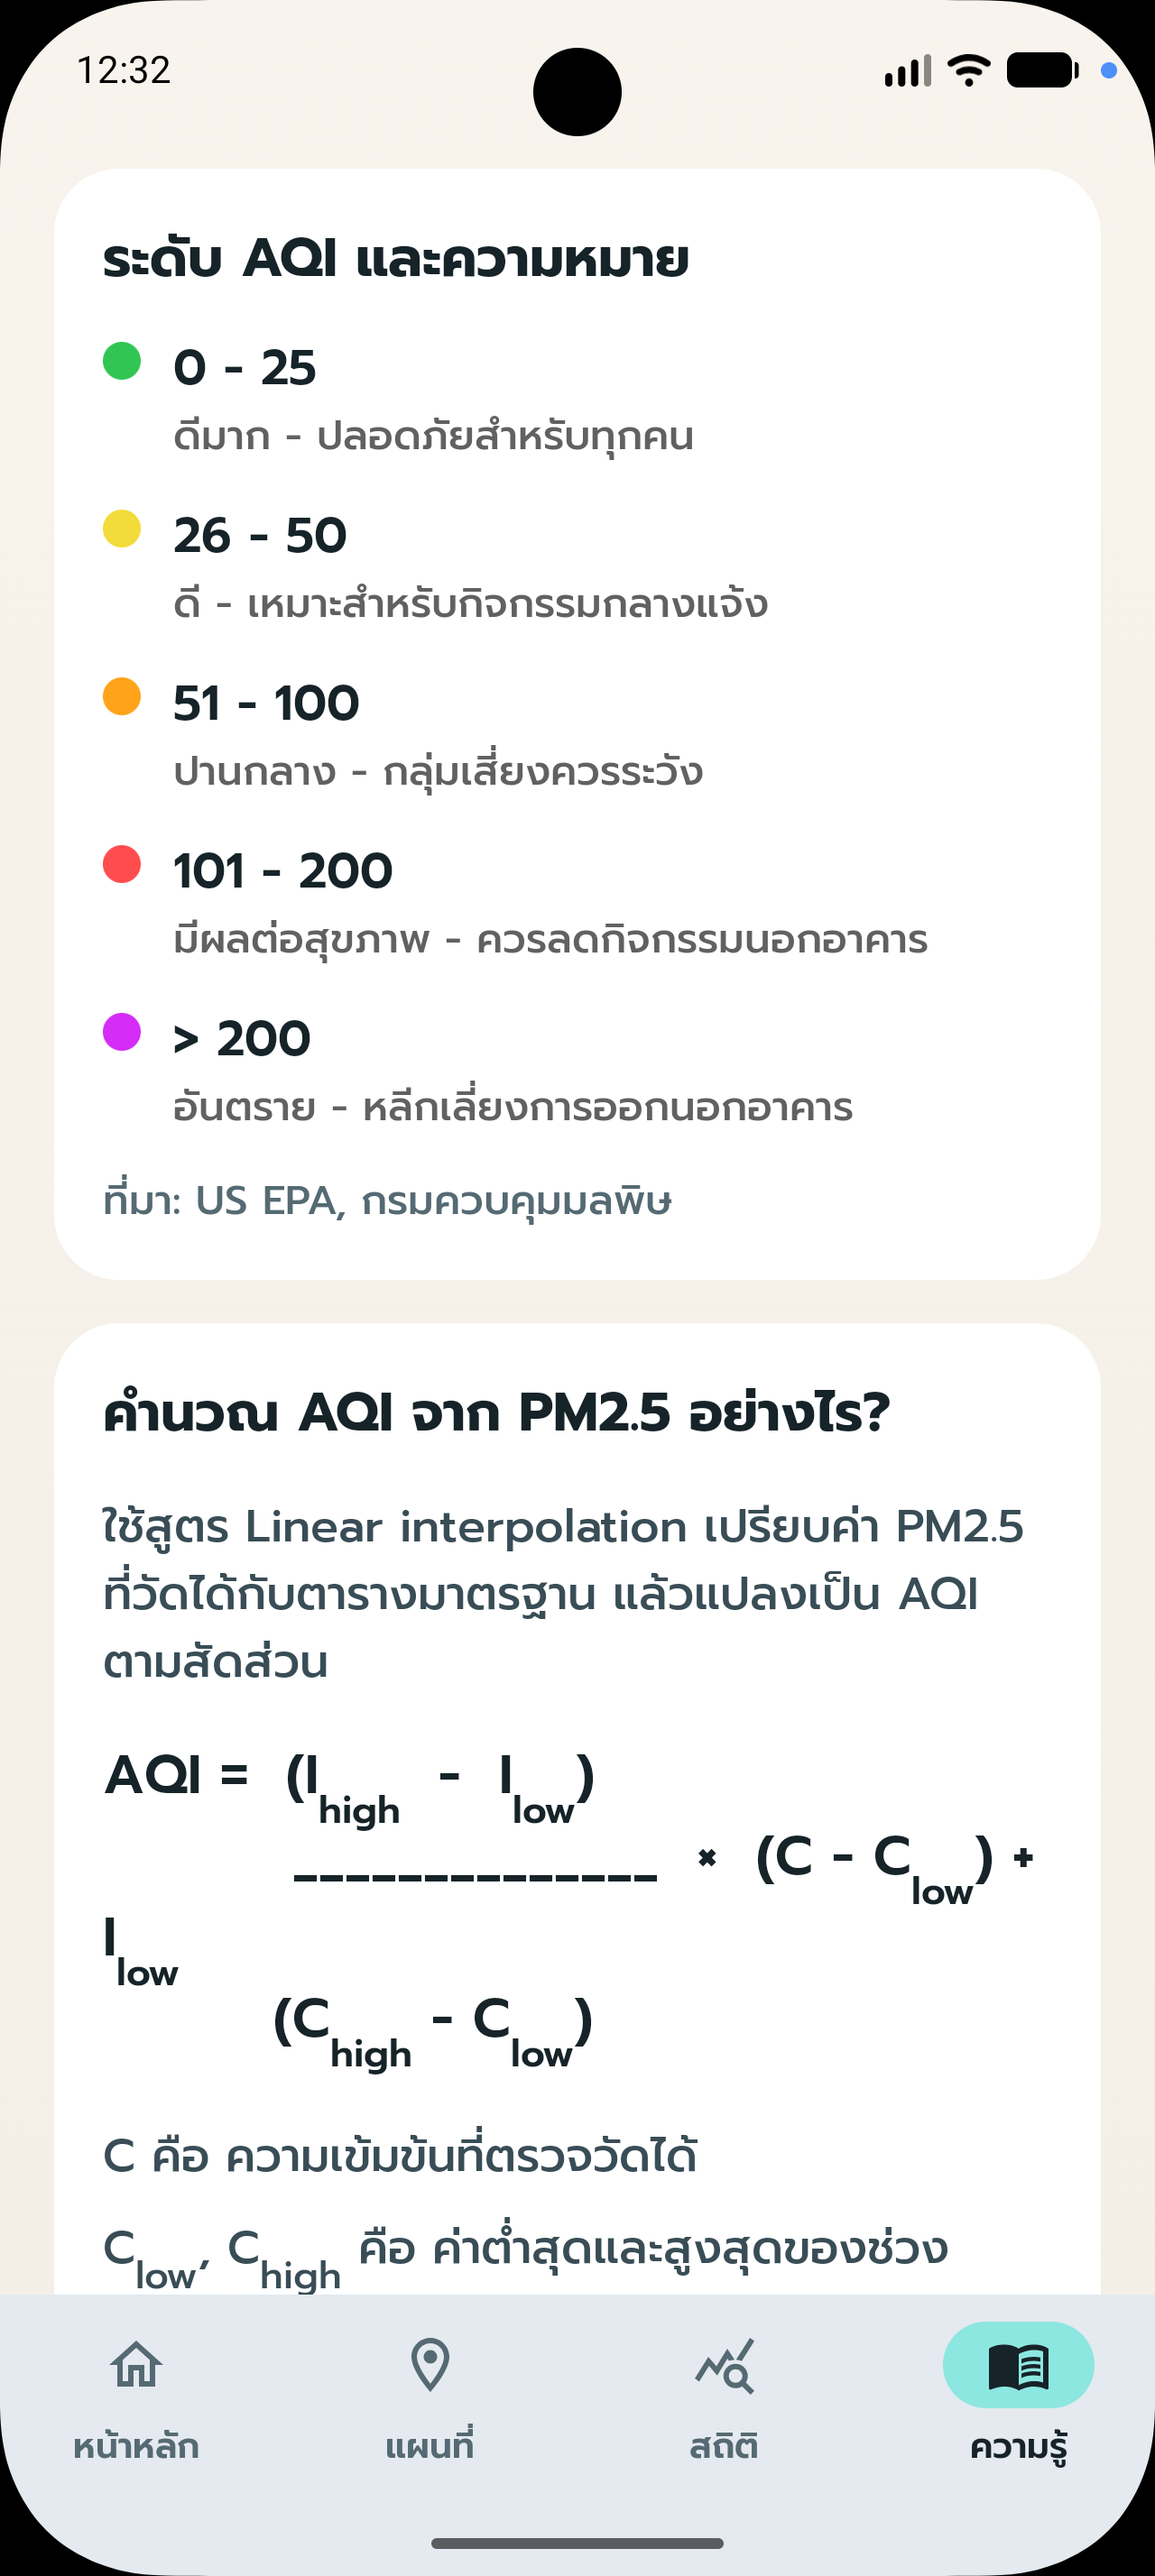
- - AQI levels and meanings
- - AQI calculation explanation
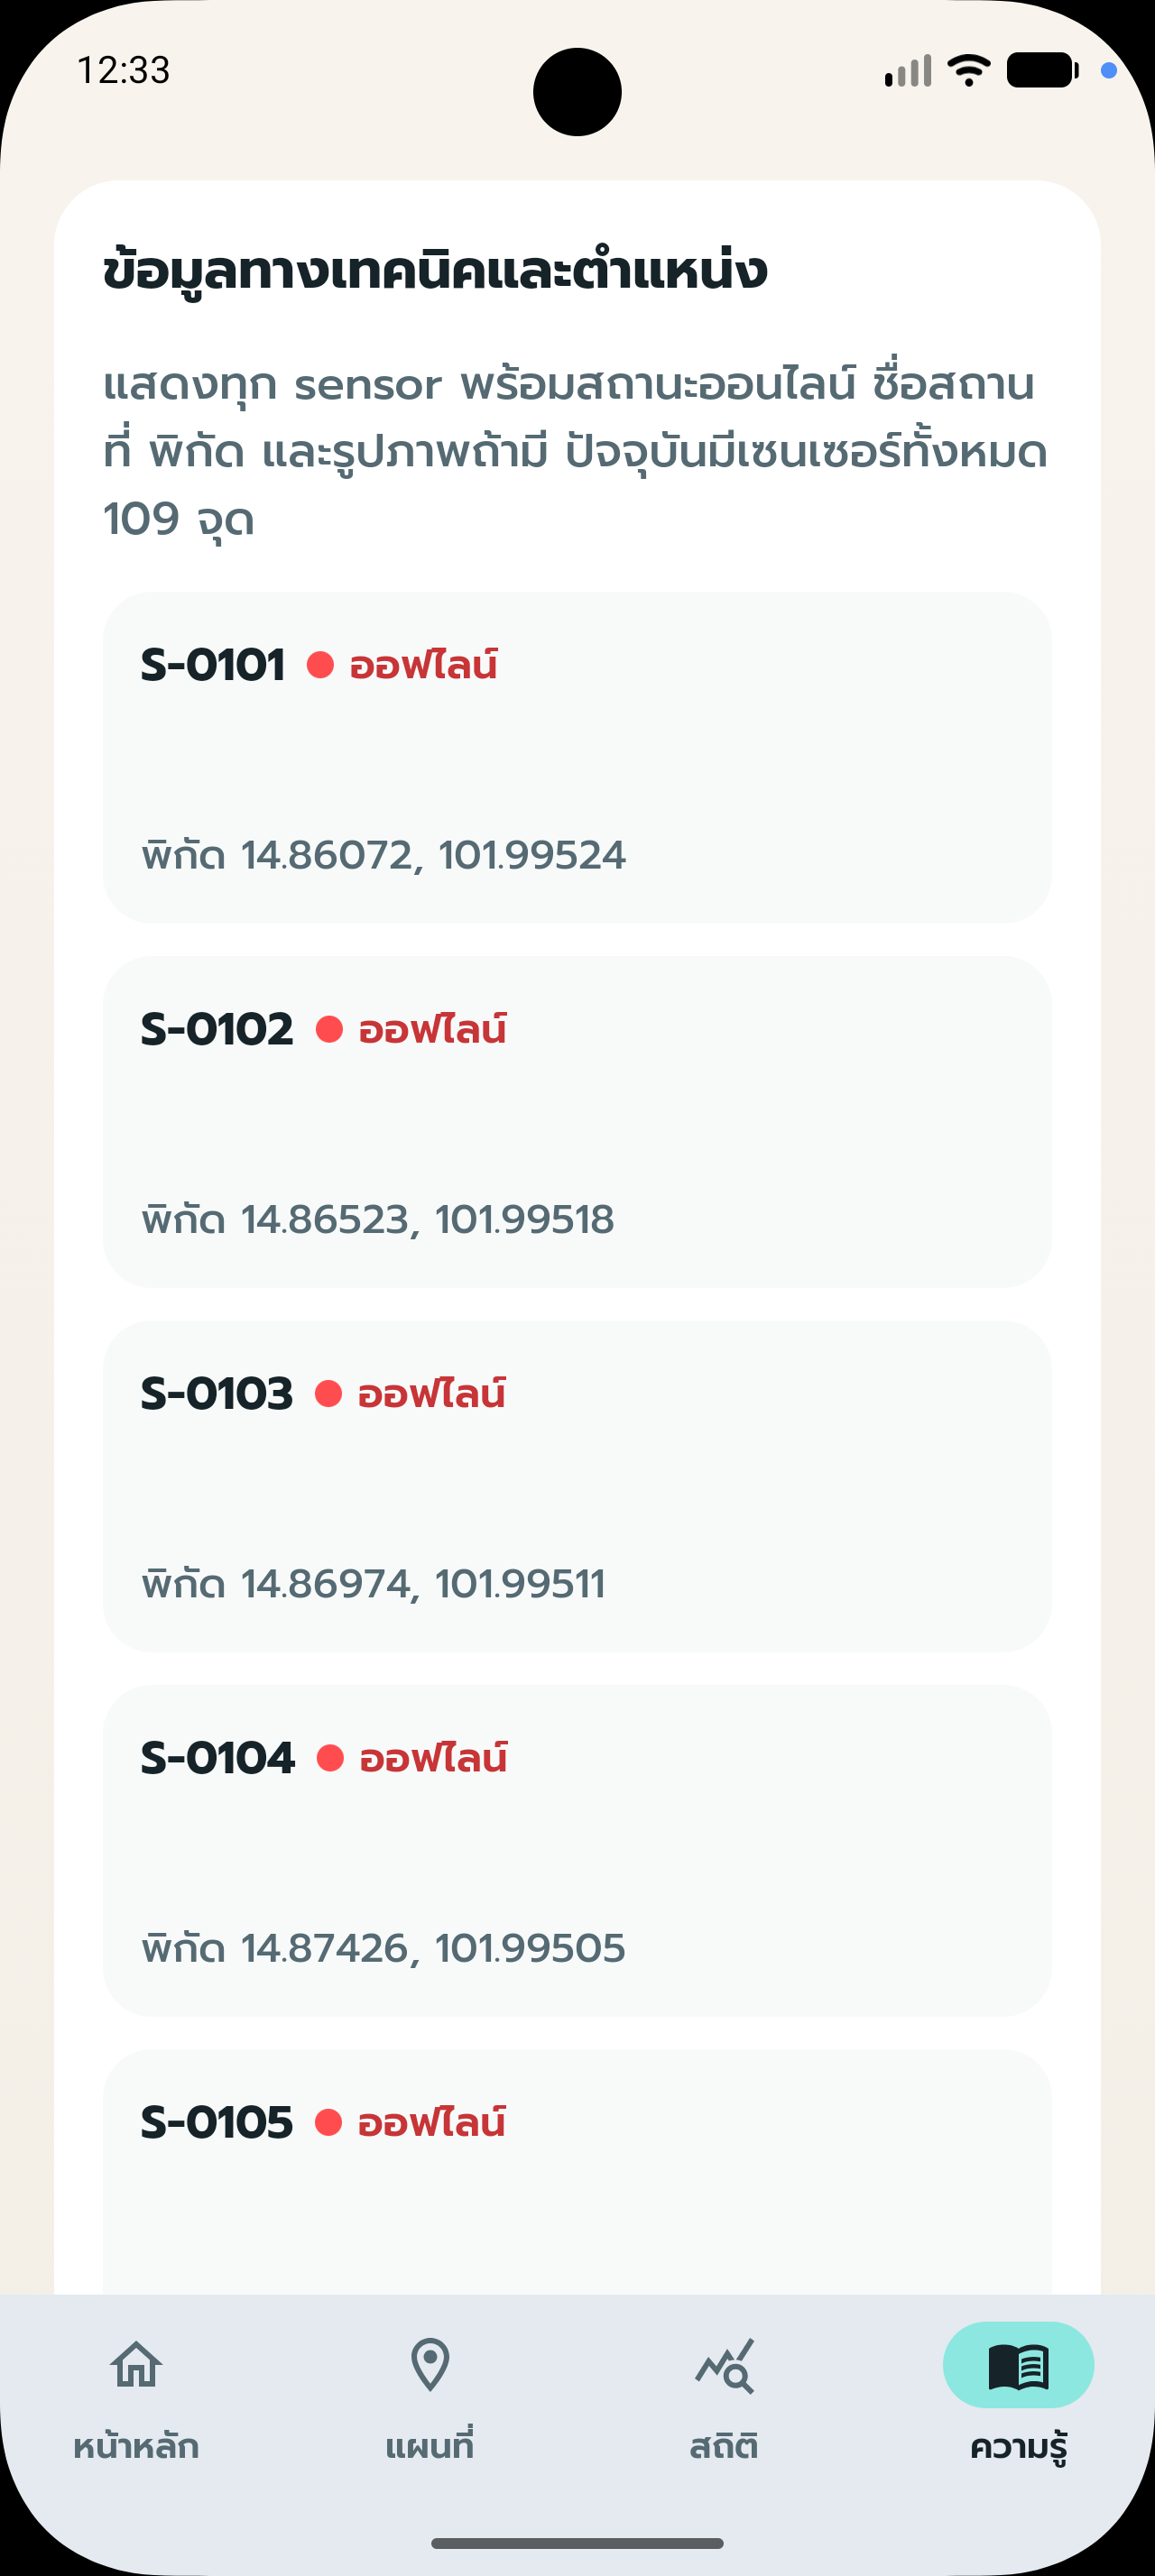
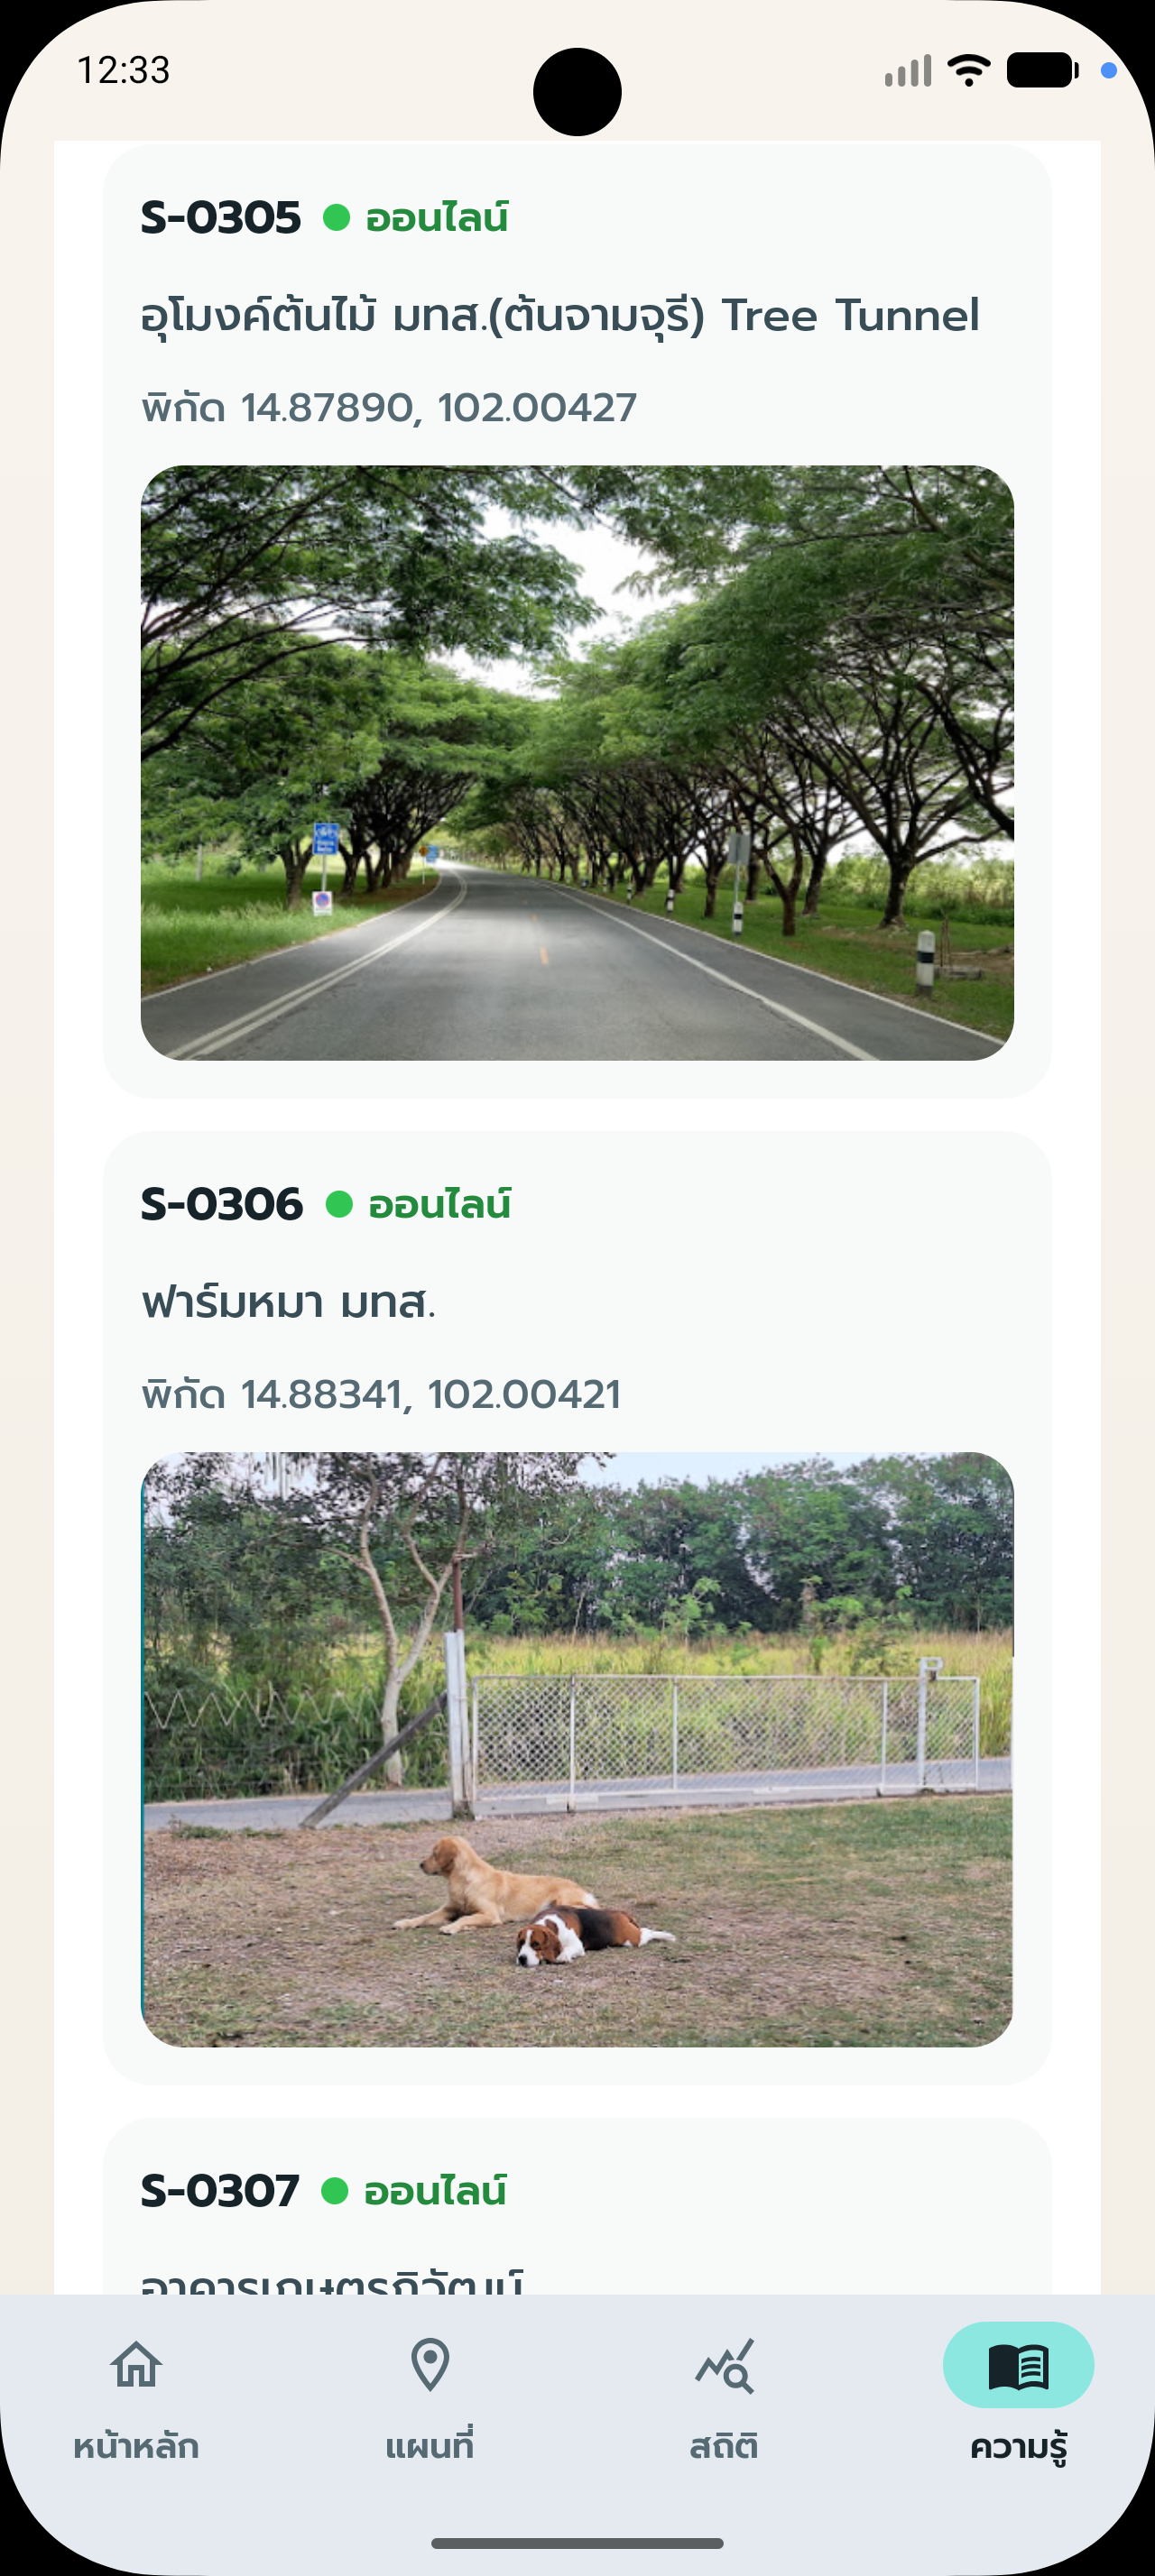
- 🔹 Sensor Monitoring System
- - Display all sensor stations
- - Online / Offline status indicators
- - Sensor coordinates and location names
- - Support sensor installation images
🔥 Highlight Features
- - Developed with Kotlin (Android Native)
- - Real-time PM2.5 monitoring
- - Google Sheet as lightweight backend solution
- - Google Maps + Isopleth visualization
- - AQI dashboard system
- - Statistical charts and data analytics
- - Educational PM2.5 content within the app
- - Clean UI/UX optimized for mobile presentation
📈 Project Results
- - Successfully transformed IoT sensor data into a real-time mobile application
- - Enabled air quality visualization through geographical mapping
- - Provided a complete graduation project solution for the student
- - Reduced complexity by using Google Sheets instead of a dedicated backend
- - Created a scalable prototype for Smart City and environmental monitoring systems
🧩 System Categories
- - PM2.5 Monitoring Application
- - Android Native Application
- - IoT Sensor Visualization System
- - Air Quality Monitoring System
- - AQI Dashboard Application
- - Smart City Prototype
- Graduation Project Application
🎯 Suitable For
- - IoT graduation projects
- - Environmental monitoring projects
- - Smart City solutions
- - Educational research projects
- - Sensor visualization systems
- - Universities and educational institutions
⚡ Technologies Used
- - Kotlin
- - Android Native Development
- - Google Maps SDK for Android
- - Google Sheets Integration
- - MPAndroidChart
- - Material Design
- - Isopleth / Contour Map Visualization
🚀 Project Highlights
PM MAP is more than just a PM2.5 monitoring app.
It demonstrates how IoT sensor data can be integrated into a modern Android application with real-time visualization, geographical analysis, and environmental monitoring capabilities.
By using Google Sheets as a lightweight backend, the project reduces infrastructure complexity while still providing real-time data synchronization and interactive map-based visualization.
This project is an excellent example of combining:
- - IoT Sensor Data
- - Mobile Application Development
- - Google Maps Visualization
- - Environmental Monitoring
- - Smart City Concepts
into one complete graduation project solution.
Project Info
Technologies Used
Project Screenshots